

Beginners Guide to the 3 Financial Statements
How much do you know about reading the financial statements of your small business? While you might not be interested in accounting and finance courses, it’s very crucial for any business owner to understand the basics of the 3 financial statements.
With this, you have a better grasp of your business’s financial position. It also helps to not be over-reliant on your accountant to understand the basic financial health of your business.
In this article, I will walk you through the basics of financial statements, including what we mean by the name financial statements, the 3 key financial statements, and what items go into each financial statement.
What Are Financial Statements?
These are financial reports that show a business’s financial performance and profitability for a specific period or a particular point in time.
There are 3 key financial statements to rely on to run your business;
- The income statement
- The balance sheet
- The cash flow statement and
- Statement of changes in equity
Related read: Accountant vs Bookkeeper: Which One Do You Need?
Understanding The 3 Basic Financial Statements
As mentioned above, there are 4 financial statements to rely on to run your business. However, for the purpose of this article, I will concentrate on the 3 most important ones you are more likely to use with your small business;
- The income statement
- The balance sheet, and
- The cash flow statement.
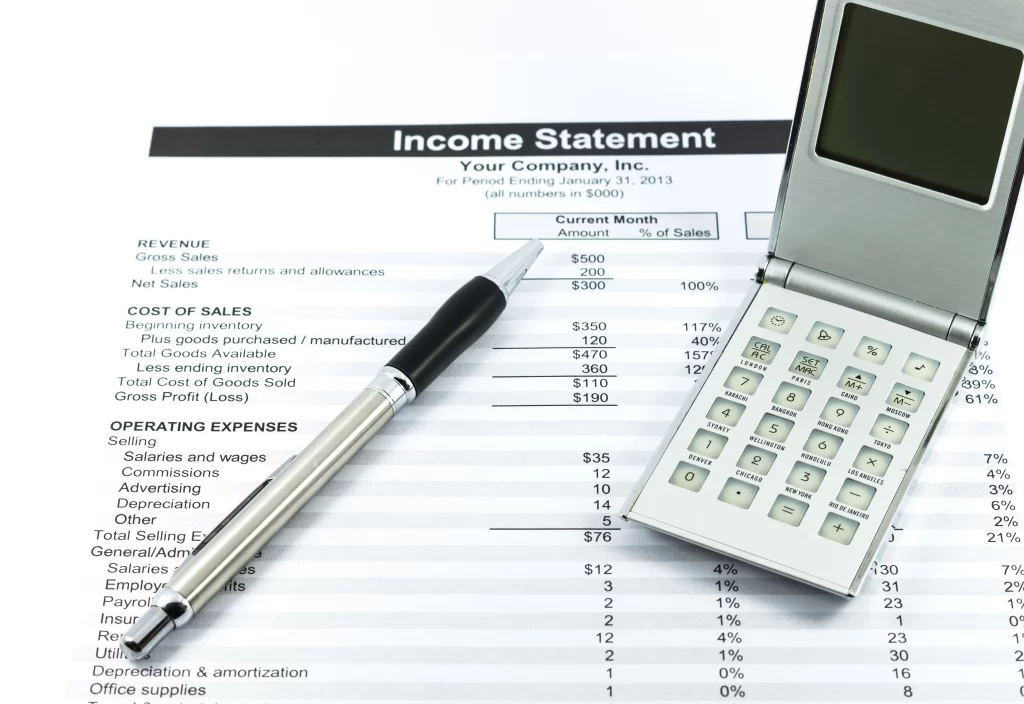
The Income Statement
A common name for the income statement is the profit and loss statement. Other names you might come across include P&L, statement of income and statement of operations.
An income statement gives you a breakdown of your business’s revenue and expenses for a particular period, e.g., annual. The bottom line, i.e., the end figure, will indicate the profit or loss for the period.
Here are some of the items you’ll see in an income statement;
Sales/Revenue
Revenue/sales is the top line item in the income statement. It shows your business’s total revenue or sales for a particular period.
Cost of Goods Sold (COGS)
COGS shows direct costs incurred in the production of products for sale. This includes the cost of raw materials, direct labor, and direct factory overheads.
However, COGS does not apply to service companies since there’s basically no physical product to sell. For service companies, there is a Cost of Sales or Cost of Revenue, representing direct expenses the business incurs while offering services to its customers.
Gross Profit
Gross profit shows the profit your business makes after deducting all the direct costs related to the production of products, i.e., COGS. It does not account for any other indirect expenses. That comes later, as you will see in the article.
The formula is very direct. You just need to subtract the COGS from the total revenue.
Gross Profit = Revenue – COGS
Operating Expenses (OPEX)
This section accounts for other indirect expenses that don’t go into the COGS. These are the usual expenses your business incurs to run its operations. The common examples include;
- Marketing and advertising
- Rent
- Utilities
- Office supplies
- Salaries and wages
- Insurance
- Depreciation
While operating expenses can be itemized, some businesses will provide a lumpsum figure under Selling, General, and Administrative (SG&A) Expenses. However, I’d recommend working with an accountant to create a chart of accounts for your business. It will help ensure the itemization of each expense category, which makes filing the tax sheet during the filing season easier for you.
Related article: What are Business Expenses? Here’s What You Need To Know
Operating Income
It shows your business’s income after deducting all operating or day-to-day expenses.
Operating Income = Gross Profit – OPEX
Some businesses will have this as Earnings Before Interest and Tax (EBIT) or Earnings Before Tax (EBIT). If your accountant provides your business’s income statement with this line item, just know that it represents the operating income.
Non-Operating Expenses
These are other expenses that a business incurs outside of its operating expenses. They are not directly related to the core activities of the business. A common example is interest expense from borrowing.
Having this as a separate line item allows you to assess the effects of expenses that relate to normal business expenses.
Earnings Before Taxes (EBT)
As the name suggests, this represents a business’s income before deducting income taxes.
It’s the number you arrive at once you deduct non-operating expenses from the operating income.
EBT = Operating Income – Non-Operating Expenses
Income Tax Expense
This is the total tax liability a business owes to the revenue authority. It’s calculated by multiplying EBT by the effective tax rate.
For example, the effective tax rate in Kenya is 30%. To calculate the tax liability, multiply the year’s taxable income (EBT) by 30%.
Income Tax Expenses = EBT * Effective Tax Rate
Learn more about reducing your tax liability with these Common Tax Deductions For Small Businesses
Net Income
The net income/loss is the bottom line in an income statement. It shows how much a business has made in that particular period after accounting for all expenses and tax liability.
Net Income = EBT – Interest Expense
The Cash Flow Statement
A cash flow statement shows how money moves within a business. With it, you can tell the actual cash inflows and outflows of your business. It’s an important financial statement to understand as a small business owner because it is an excellent guide to your business’s financial health.
An income statement shows the profit or loss made in a particular period. However, if you are using the accrual method of accounting, there will be a difference between the timing of when money is earned and when the actual cash is received or paid out. And that’s where the statement of cash flow comes in handy.
For instance, let’s say your business sold an item to a client on credit on the last day of the year. We are in the first week of the new year, but you have yet to receive the cash payment for this sale. The sale will appear in the income statement for the previous year as revenue. Since the client has yet to pay that money, it will not reflect in the cash flow statement for that period. The same applies to any expenses where the cash has not left your bank account.
Related read: Understanding Profits vs Cash Flow For Your Small Business
A cash flow statement has 3 sections, cash from;
- Operating activities
- Investing Activities
- Financing Activities
When added together, cash from these 3 sections leads to the bottom line of the cash flow statement. The ending line item in the cash flow statement shows the cash balance at the end of the period.
Cash From Operating Activities
This shows cash from the day-to-day activities of your business. It includes cash from sales and payment of expenses. In addition, it also includes adjusting for non-cash items, like depreciation and changes in working capital.
Cash From Investing Activities
It shows transactions involving purchasing or selling fixed assets and long-term securities. Examples of cash from investing activities include;
- The purchase of PPE (plant, property, and equipment) – cash outflow
- Investment in bonds and shares from other companies – cash outflow
- Acquiring a new business – cash outflow
- Sale of fixed assets, including PPE and intangible assets – cash inflow
- Sale of investments like bonds and shares – cash inflow
Some businesses might have this under one line item instead of itemizing, especially if the major activity was just on physical assets. In such cases, you will see it as capital expenditure (Capex).
Cash From Financing Activities
These are cash transactions that show how the company is funded. The activities can either increase or decrease the equity or liability levels of the company. Common items under this are debt, equity, and dividends.
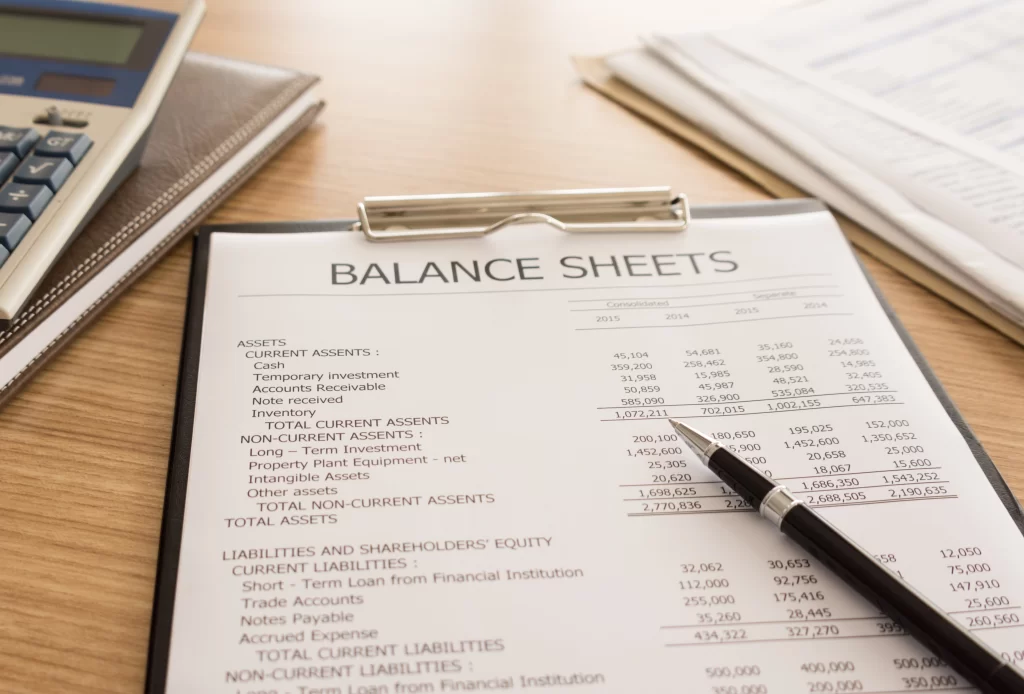
The Balance Sheet
It’s also referred to as the Statement of Financial Position. A balance sheet shows the financial position of a business for a specific point in time, usually the last day of the year. You, investors, and other stakeholders can use the balance sheet to tell your business’s worth.
A balance sheet has 3 components: assets, liabilities, and owner’s equity. These lead to the balance sheet formula, where assets must equal liabilities and owner’s equity.
Assets = Liabilities + Owners Equity
Assets
These are items that the business owns. Assets can be tangible, like equipment and inventory, or intangible, like patents and other intellectual property.
In a balance sheet, however, assets are categorized as;
- Fixed Assets – also referred to as non-current or long-term assets. These are any assets the business owns that are not easily converted into cash. These include property, equipment, furniture, and intangible assets.
- Current – represents liquid assets, i.e., items that can be converted into cash within 1 year. These include inventory, cash & equivalents, and accounts receivable.
Liabilities
These are funds your business owes other parties, like banks and suppliers. Like assets, liabilities are broken down into two categories;
- Long-term liabilities – also referred to as non-current liabilities. This represents debts that are payable in more than a year. A good example is loans from banks with a repayment period of more than a year.
- Current liabilities are debts that are payable within a year, e.g., accounts payable (money owed to suppliers).
Owners Equity
As the name suggests, owner/shareholder’s equity indicates the value of the shareholder’s investment in the business. The common items under this are retained earnings and owner’s contribution.
Owner’s Equity = Assets – Liabilities
Connecting the 3 Financial Statements
Did you know that the 3 financial statements link to each other? Here’s a basic idea of how it works;
How The Income Statement Connects to the Cash Flow Statement
As mentioned earlier, the ending balance of the income statement is the net income/loss. This line item connects the income statement to the cash flow statement.
The net income flows into the cash flow statement, appearing as the first item under Cash From Operating Expenses.
How The Cash Flow Statement Connects to the Balance Sheet
Remember that the ending line item in the cash flow statement is the cash balance at the end of the year? Well, this balance is what flows into the balance sheet under non-current assets.
In Conclusion
As a small business owner, it is important to understand the basics of financial reporting. And that starts with knowing how the 3 financial statements work. With this, you can tell the financial health of your business. Plus, these financial statements will come in handy when you need to raise funds from third parties, like borrowing from a bank.
Although you can prepare these reports on a spreadsheet, like Excel or Google Sheets, I’d highly recommend getting accounting software. It makes your work less hectic, more organized, and more seamless. And these programs provide real-time financial reports based on your entered data.